Growth in Indiana ESOPs
Has there been growth in the number of ESOPs in Indiana over time?
The simple answer is YES!
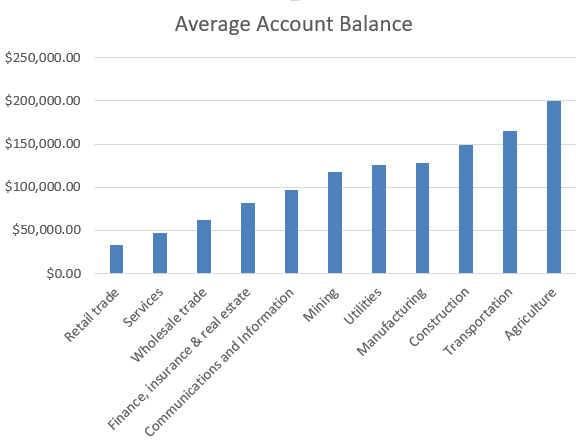
From the 2010 DOL 5500 data, Indiana was home to 160 ESOPs, providing wealth generation for 96,131 Hoosiers. Five years later, the 2015 DOL 5500 data, identifies the number of Indiana ESOPs at 176 a 10% increase. See table 1 for a breakdown of ESOPs per industry type. In 2015 the total number of participants are 130,768 a 36% increase over 2010. The overall average (total assets divided by total participants) 2015 ESOP account balance was $89,565. However, if we examine the plan assets based on specific industry average (See Table 2) we see a large variance in the average accounts. This is based on the plan assets and total number of participants in each industry.
Table 1: Number of Indiana ESOPS per Industry Type
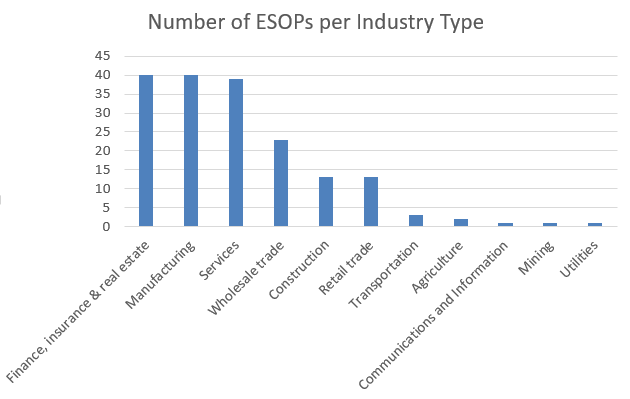
Table 2: Average Account Balance per Industry Type
Is a 10% growth in ESOPs adequate of Indiana? I think not. The 2016 Annual Survey of Entrepreneurs (ASE) survey (N=105,583 Indiana firms reporting) identified 33,974 business owners between the age of 55-64, with an additional 21,954 business owners over the age of 65. This data implies that over 53% of the reporting companies have business owners nearing or at retirement age.
What will happen when these business owners seek to retire? According to Project Equity only 20% of all the business listed for sale ever sell, 33% of business owners over the age of 50 report having a hard time finding a buyer, and only 15% of business get passed down to the 2nd generation.
If we assume 35% of these Indiana business listed in the ASE sell or are passed down to the next generation, this leaves the future of over 36,000 Indiana businesses in question. Wouldn’t it be better if these business were sold to their employees and continued to contribute to our Indiana communities?